In the heart of every grassroots organisation lies a passion for people and community. Whether you're running a food co-op, a local health initiative, or supporting whānau in need, chances are you're collecting a lot of valuable data—attendance numbers, service use, feedback, outcomes. But how do you make sense of it all without getting lost in spreadsheets?
That’s where dashboarding comes in and tools like Tableau and Power BI make it easier than ever for small, resource-stretched teams to turn raw data into powerful, visual insights.
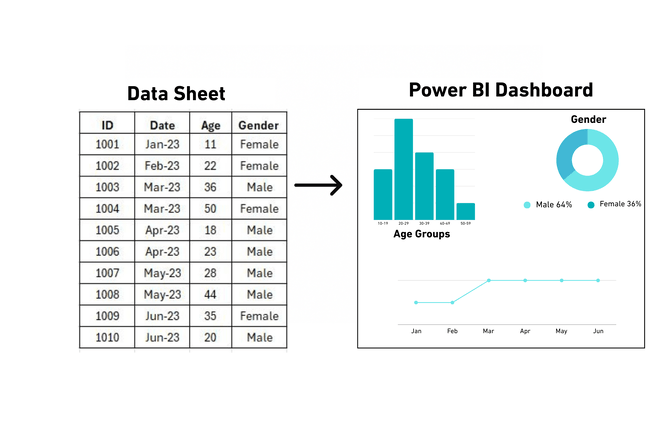
What is Dashboarding?
Think of a dashboard like the instrument panel in a car. It gives you a clear, real-time view of what’s going on—speed, fuel level, engine health—so you can make smart decisions. A data dashboard works the same way. It helps you track key information about your organisation and see it all in one place: who you’re reaching, what’s working, and where the gaps are.
What Can You Use a Dashboard for?
Here are a few practical examples:
Track attendance at community events or programmes over time
Visualise client demographics (age, ethnicity, needs) to show your reach
Monitor funding spend and outputs for contract reporting
Map impact areas to see where services are being accessed
Compare programme outcomes before and after service delivery
Dashboarding = Storytelling
Data dashboards aren’t just about numbers—they’re about telling your story. Funders, community boards, and even your own team can benefit from clear, visual evidence of the difference you’re making.
When you dashboard your data, you’re saying:
“Here’s what we’re doing. Here’s why it matters. And here’s where we can grow.”
We have talked previously about Tableau and now it is time to put the spotlight on Power BI.
Power BI is a free (and very powerful) tool from Microsoft that allows you to create interactive dashboards. You can connect it to Excel, online forms, databases, and even services like Google Sheets or SharePoint.
Here’s why it’s especially good for small to medium sized organisations:
✅ It’s free to start (Power BI Desktop is completely free)
✅ Visual and user-friendly – no coding needed
✅ Automates your reporting – saves hours of copying/pasting
✅ Helps with funding reports and accountability – back your impact with evidence
✅ Brings your data to life – see trends and insights at a glance
For local organisations, every dollar and every hour counts. Power BI can help you use both more wisely—giving you insights that guide smarter decisions, strengthen your case for funding, and showcase your impact with confidence.
We have Power BI training coming up over two sessions in the next couple of months, Level 1 on 12 June followed by Level 2 on 3 July. Click here to find out more or contact us to discuss your organisation's needs as the Community Insights team can walk alongside you to develop the dashboards and you will then have the skills to refresh and update them.