Ever wondered how many people actually live in your area, or how your suburb compares to the rest of the city?
To build a stronger, more connected community, we need to understand the "who, what, and where" of our neighbourhood. That’s where Data Summaries come in—they delve into the specifics of each area and visualise the data into clear, easy to digest insights.
Data summaries don't just tell us who we were—they help us decide who we want to become. By diving into these numbers, we can work together to ensure our community remains a great place to live, work, and play.
Why Does This Matter to You?
Data is knowledge and knowledge is power. When we have the facts, we can move from "I think" to "I know."
Community Organisations: Use this data to advocate for the service your organisation provides which helps to meet a need identified in the Data Summary.
Local Leaders: Make evidence-based decisions that reflect the actual needs of the people living here.
SociaLink’s Community Insights team recently completed a series of 14 Data Summaries for Western Bay of Plenty District Council and a Data Summary on Pāpāmoa East for Tauranga City Council.
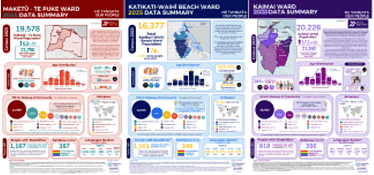
Click here to view the 14 Western Bay of Plenty and Pāpāmoa East Data Summary Infographics.
What’s Inside a Community Data Summary?
Think of a data summary as a "health check" for local areas. It compiles information from various sources, such as Census 2023 and StatsNZ, to paint a complete picture across several key areas:
1. HE TANGATA | OUR PEOPLE
Population & Age: Are we a "young" suburb full of families, or a quiet area with a growing ageing population? Knowing the age distribution of individual suburbs helps us advocate for the right services, like more playgrounds or community centres.
Ethnicity: Data summaries highlight our cultural diversity, ensuring local events and communications are inclusive and representative of everyone.
2. Households and Housing
This looks at how we live—whether we live alone or with family, do residents own their homes and what is the cost of renting. It’s a vital tool for discussing housing affordability and urban planning.
3. Income & Community
This section tracks the economic heartbeat of the area. It helps identify if the local economy is thriving through local businesses and income levels compared with district, regional and national levels.
What are the levels of deprivation in the area and what are the gaps where residents might need more support through lack of access to things like vehicle and internet.
4. Education and Employment
What sectors do people work in? What level of schooling do our young people reach? This data helps local businesses understand the workforce and helps schools tailor their programs.
5. Ngā Iwi Māori
Understanding Iwi affiliations and the Māori population is essential for honoring Te Tiriti and supporting Māori-led community initiatives.
6. Deprivation Levels
The Deprivation Index measures relative poverty and access to resources. By identifying areas with higher deprivation levels, the community can direct funding, healthcare, and social services to where they are needed most.
We have training coming up in Maketū and Te Puke looking at the Data Summary Infographics and how organisations can access other data related to individual local communities. Also keep an eye out for training in Ōmōkoroa coming soon.
As always the Community Insights team is here to help where we can. Contact us if you are interested in a Data Summary for your community or if we can provide any assistance to help you with anything data related.